


Boletín Comisión de Geoespeleología
FEDERACIÓN ESPELEOLÓGICA DE
AMÉRICA LATINA Y DEL CARIBE, A.C.
(FEALC)
![]()
BOLETÍN INFORMATIVO DE LA
COMISIÓN DE GEOSPELEOLOGÍA
No. 40, Octubre 2003
Coordinador: Prof. Dr. Franco Urbani
Sociedad Venezolana de Espeleología. Apartado 47.334, Caracas 1041A, Venezuela.
Telefax: (58)-212-272-0724, Correo-e: urbani@cantv.net
Este Boletín es de carácter informal -no arbitrado- preparado con el objetivo de divulgar rápidamente las actividades geoespeleológicas en la región de la FEALC. Sólo se difunde por vía de correo electrónico. Es de libre copia y difusión y explícitamente se solicita a quienes lo reciban que a su vez lo reenvíen a otros posibles interesados, o lo incluyan es páginas web. Todos los números anteriores están disponibles. Igualmente se pide que obtengan copias en papel para las bibliotecas de sus instituciones. Se solicitan contribuciones de cualquier tipo y extensión para su divulgación.
Hydrogeochemical patterns and mathematical correlations
in karst at the examples of Cuba. |
1-4 |
| Hydrology and dynamics of the
tropical karstic processes in Cuba. |
4-8
|
| Cockpit Country in Jamaica | 10-11
|
| Karst landforms and lakes | 11-19
|
| Book review | 19
|
Copied
from: http://www.karst.edu.cn/igcp/igcp299/1992/92.4.htm
RECENT RESEARCH BY IGCP 299 PARTICIPANTS
HYDROGEOCHEMICAL PATTERNS AND MATHEMATICAL CORRELATIONS IN KARST AT THE EXAMPLES OF CUBA
J.R.Fagundo Castillo and J.E.Rodriguez Rubio (Cuba)
Introduction
In this paper, the hydrogeochemical patterns of some karst and non karstic waters from Cuba , as well as the mathematical correlations between ionic contents and electric conductivity of the waters, are presented. Anthropogenic on karst are also discussed in terms of variations in mineralization , hydrogeochemical patterns and mathematical relationship in the long run.
Materials and Methods
As criterion of good mathematical agreement we use in this paper the similarity index SI defined by:
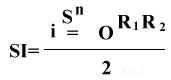
where:
R1: relation between the ionic concentration obtained by chemical analysis
and modeling;
R2: relation between each ion and the total sum of ions.
Further control of chemical composition of waters can be made by means of the corresponding mathematical
equations and the measurement "in situ" of electric conductivity.
The theory which support the use of referred computer programs has been
recently reported ( Fagundo , 1990).
The hydrogeochemical patterns are represented in this paper by means of
the diagrams proposed by Stiff(1951) and the stecheometric relations Na++K+:Ca2+:
Mg2+:Cl-:HCO3-:SO42- ,
where the sum of anions and cations are both equal to 10 meq/1.
Results and Discussion
In order to study the physical chemical behaviour of the karst waters , its hydro-geochemical patterns and changes developed by the effect of natural and anthro-pogenic factors , two typical Cuban karst areas were chosen : San Marcos river basin in Sierra del Rosario and the developed karst in southern plain , both in Pinar del Rio province , representatives of mountain and coastal plain tropical karst , respectively.
San Marcos River Basin
The lithology and the water flow
conditions are the major factors that determine the chemical
composition of the waters and the hydrogeochemical
patterns. We can distinguish the following water types: sodium calcium
hydrocarbonate for waters from the sedimentary-effusive rocks
, magnesium hydrocarbonate for the waters which originate
in the ultrabasic massif , and calcium hydrocarbonate
for that waters which flow in the karst areas (at the source
, caves , exsurgences and springs from the saturation zone
). Finally , there are waters of calcium sulphate
type from the karst deep drainage (deep phreatic zone).
These waters change the absolute chemical composition as a consequence of the rain regime
, but practically do not undergo changes in its relative
chemical composition. The ion stecheometric relations are the same for each
sample. Similar bahaviour in other systematic sampling points in other regions
was observed.
The hydrogeochemical patterns of the waters from San Marcos basin in terms
of the corresponding stecheometric relations, appear in Tab.1.
Linear equations were obtained when concentration in each ion and electric
conductivity data were fitted. The slopes of the corresponding regression
equations are also listed in Tab.1. The magnitude of the slopes are functions
of the ionic concentrations of the waters and the local lithology.Three
hydrogeochemical patterns characterize all karst waters of the basin and there
are other two for the non karstic waters.
The mean similarity index between real and theoretical values of the
chemical composition is also expressed for each type of water in Tab.1.
Pinar del Rio Southern Coastal Karstic Plains
In the southern part of Pinar del
Rio province , there are a great karst massif constituted by
Miocene limestones , partially dolomitized and occasionally
covered by Quaternary sediments. In this area , a rich aquifer
occurs whose recharge zone is in the premountains region at the
North , and it is freely discharged to the sea at
the South. The waters in the aquifers are of calcium hydrocarbonate type
in the zone non affected by the seawater mixing. Toward
the coast , some hydrochemical facies occur as the result of
the mixing between fresh and marine waters. They are stratified
along the vertical profile of each well and a horizontal
profile across the aquifers (Arellano and Fagundo , 1985).
There are also different modes of water chemical evolution in this region ,
which depend on the dolomitization degree of the sampling site inside the
aquifer. In such conditions different contents of magnesium for the same
seawater mixing level exist. We have observed at least
, four chemical evolution paths for the waters of these regions
as well as for other coastal karst aquifers in Cuba.
We have occasionally observed changes in the original hydrogeochemical patterns in
some sampling points (well) in the long run. Generally , it is
due to a decrease in the rain regime and/or an increase in the aquifer
overexploitation. In this case , the mineralization and NaCl salinity showed a
progressive increase during the observational period. The additional quantity
of foreign ions as Na+ , K+ and Cl- in hydrocarbonate
water increase calcite and dolomite solubility and
considerable quantity of carbonate rock can be dissolved from the
aquifer.
In this type of water the corresponding fitting of the ion contents and
electric conductivity data is more significant for the second degree than
linear equations if all the data are processed. Better results can be obtained
processing the data corresponding to each hydrogeochemical pattern(see table
2).
In this case , mathematical equations are of linear type. Using these
expresions and the electric conductivity measurement in field by means of a
conductometer connected to a 100m probe it is possible to control the chemical
composition and salinity of the waters , but we need to take into account the
range in which each sampling point reflects the different hydrogeochemical
pattern(see table 3).
Conclusions
The lithology and the water flow conditions
determine the hydrogeochemical patterns , characterized by
a given stecheometric relation. In the case of
tropical karst and non karstic waters there is
, generally , one hydrogeochemical pattern
in the same sampling point , where many of the factors remain
constants. In case of underground waters there are less changes
of the relative chemical composition than in
the first surface waters. A discret number
of hydrogeochemical patterns can characterize all the waters running
through the limestones.
More variability can be distinguish in coastal karst aquifers encroached
by seawaters , where waters in the aquifer are stratified along vertical and
horizontal profiles. In such cases, different chemical facies in the same well
occur.
The human activity can change the natural hydrogeochemical patterns in the
karst as a consequence of the waste water input , the chemical treatment in
the agriculture and the aquifer overexploitation. In coastal karst areas
, the latter increases signifi-cantly the water salinity and the karstic processes.
In all the cases , empirical mathematical relationships were found between
ionic chemical composition and the electric conductivity of the waters. In
one of the controlling factors of the chemical composition acquisition is dominant
, as for instance , the lithology , the most accurate equations are of the linear
Type , but if more than one of these factors play the major role in the mode
of chemical compo-sition acquisition we can found that non linear equation
are the better when all the data are processed, and linear equation are the
best when the corresponding data of each hydrogeochemical pattern are separately
processed. By means of these equations and field measurements of electric
conductivity it is possible to control the water quality in terms of chemical
composition, mineralization and salinity.
Tab.1 Hydrogeochemical patterns (as a function
of the stecheometric relations); slopes of the linear relationship
between ionic concentration and electric conductivity of the
water from the San Marccs river basin, and the similarity index
(SI) between real and modelling values of the chemical composition
________________________________________________________________________________
Geological environment N stecheometric relation
slope of the regression equation SI
Na+K Ca Mg Cl HCO3 SO4 HCO3 Cl SO4 Ca Mg Na+K
_________________________________________________________________________________________
Sedimentary-effusive 34 3 5 2 1 9 0 10.013 1.276 0.393 5.947 1.933 3.802 0.894
Ultrabasic 13 1 0 9 0 9 1 10.537 1.253 0.332 0.338 10.296 1.478 0.898
Limestones from Guajaibon
and Chiquita formations 140 2 7 1 1 8 1 8.994 1.003 1.148 7.148 7.832 1.242 0.883
Limestones from Mil
Cumbres region 27 2 7 1 1 8 1 9.57 0.912 1.405 8.751 1.005 2.131 0.893
Water from karst deep
drainage 12 2 7 1 0 1 9 0.781 0.276 7.866 6.256 1.157 1.510 0.978
_________________________________________________________________________________________
Tab.2 Hydrogeochemical patterns (as a function
of the stecheometric relations) slopes of the linear relationship
between ionic concentration and electric conductivity of the
water from some wells of Pinar del Rio s outhern coastal karst
aquifer and similarity index (SI) between real and modelling
value of the chemical composition
________________________________________________________________________________
Hydrogeochemical N Stecheometric
relation slope of the regression equation SI
pattern Na+K Ca Mg Cl HCO3 SO4 HCO3 Cl SO4 Ca Mg Na+K
_________________________________________________________________________________________
HP1 4 2 8 0 2 8 0 6.558 1.923 0.251 6.890 0.438 1.404 0.932
HP2 5 2 7 1 4 6 0 5.609 3.541 0.227 5.884 1.000 2.493 0.923
HP3 3 4 5 1 5 5 0 4.583 4.570 0.449 4.924 1.149 3.529 0.958
HP4 4 5 4 1 6 4 0 3.685 5.421 0.419 4.008 1.229 4.218 0.945
HP5 10 5 3 2 6 4 0 3.134 6.019 0.367 3.340 1.311 4.869 0.898
HP6 4 6 3 1 7 3 0 2.436 7.487 0.406 3.121 1.618 5.590 0.936
HP7 11 6 3 1 8 2 0 1.710 7.778 0.633 2.510 1.492 6.119 0.919
HP8 21 7 2 1 8 1 1 0.986 8.055 0.574 1.604 1.400 6.611 0.931
HP9 6 7 1 2 9 1 0 0.628 8.477 0.558 1.265 1.700 6.698 0.941
HP10 7 8 1 1 9 1 0.282 8.913 0.665 0.844 1.419 7.567 0.944
__________________________________________________________________________________________
Tab.3 Electric conductivity ranges in which each
well from part of the Pinar del
Rio coastal karst aquifer reflects the different hydrogeochemical patterns ___________________________________________________________________________________
Well Deep HP1 HP2 HP3 HP4 HP5 HP6 HP7 HP8 HP9 HP10
__________________________________________________________________________________
P2 60-100 300-399 400-585 590-689 690-969 970-1219 1200-1879 1820-3779 3780-4691 4700-6000 >6000
P4 60-90 600-794 800-1279 1200-1799 1800-2449 2450-5159 5160-7000 >7000
P5 20-50 500-999 1000-1699 1700-1839 1840-4249 4250-7709 >7710
P1 70-100 400-529 530-649 650-779 780-950
P6 60-90 200-359 360-449 450-1699 1700-4000
P3 30-40 600-999 1000-1699 1700-2288 2300-2899 2900-4399 4400-8299 >8300
P7 40-70 500-849 950-4129 4130-7399 >7400 ________________________________________________________________________________
HYDROLOGY AND DYNAMICS OF THE TROPICAL KARSTIC PROCESSES IN CUBA
J.E.Redriguez and J.R.Fagundo (Cuba)
Abstract
Since 1975 , Cuban karst hydrological and hydrochemical characteristics and the dynamics and intensity of the karstic processes,have being investigated by a group of Cuban specialists. A research program in order to asses intensity of the contemporary karstic processes in some karstic regions of the world started in 1984. This research program is a part of the Cuban- Polish collaboration on the International Commi ssion for Physico-Chemical and Hydrological Karst Research of International Union of Speleology. The Pan de Guajaibon massif in western Cuba was chosen for this research as an experimental representative area of the tropical lower mountain karst. Other karstic localities in plains , hills and lower mountains were also chosen for developing similar investigations , as validaion areas. Some results of the hydrodynamic and hydrogeochemical characteristics of the karstic massifs were obtained and different karst circulation regimes were found , as well as the quantitative determination of these massifs response for rainfalls by using a typical water debit response curves and hydrochemical composition. Moreover , the influence of intensive tropical rains action and their spetial and temporary distribution on the karst denudation process were studied. The karst denudation was calculated by a hydrochemical method. Values of 40-50 and 115-130 m3/km2 year respectively were reported in Pan de Guajaibon massif. Same values in another validation karstic areas of the country have been determined.
Introduction
About the 65% of Cuban territory (71,500km2) is covered by limestones from Jurassic to Quaternary age , in greater or lesser degree affected by the karstic processes , where 85% of the underground water reserves in the country are concentrated and the large number of rivers are circulating in direct interaction with this geological environment. The rainfall amount and its spatial and temporary distribution together with other non-climatic factors , e.g. , lithology , relief ,geological structure , hydrology and vegetation , have greatly influenced the karst development intensity and its typology as well. Thus , the joined occurrence and development of many karst types with different hydrodynamical and geomorphological characteristics and under identical climatic conditions , give place to find in Cuban territory vasts karst plains--the most extended karst type in the country--as well as hills , plateau and lower mountains karst types, stand out among the latter, the cone and tower karst , which , although appear like a typical in tropical regions , are not the most frequent in the Cuban territory.
Pan De Guajaibon Experimental Area
The Pan de Guajaibon massif is found belonging to the Northwestern extreme part of Sierra del Rosario , Pinar del Rio province. It is a 10km2 are a composed of two parallel carbonate massifs --Pan de Guajaibon and Sierra Chiquita-separated by an upper karstic valley. The highest point is Guajaibon peak 692m.a.s.l. The experimental area is drained by the San Marcos river basin and has a pluvio-metric network with one pluviometer each 2km2 , two gauging stations installed in the massif springs and a standard climatic station for the air temperature and relative moisture records. The annual and seasonal climatic mean values parametres and rainfall distribution for the observational period in the experimental area , can be seen in the Tab.1. From a geological point of view , this is a very complex region , typical of the overthrust and nappes tectonical style and composed by a really lithological mosaic. By using standard field methods and equipments, the hydrochemical analysis and water PH , temperature and electric conductivity , were measured and recorded. From an hydrochemical point of view , all the massif circulation , waters are calcium-hydrocarbonate , except the waters from the allogenic feeding zone in the northeast of the massif, which have circulated on effusive-sedimentary rocks and are sodium-calcium-hydrocarbonate waters. Taking into account the results of Pan de Guajaibon hydrological characteristics , it is possible to affirm that from a hydrodynamical point of view , it is a merokarst massif without deep circulation below base level. Due to the karst processes intensity and forms development , the massif runoff is fundamentally underground and it is integrated by two continuous karstic drainage systems-Ancon and Canilla. The Canilla system feed is a mixture of autogenic and allogenic runoff , with circulation at the same level of the surface rivers Laslevel. Whereas the Ancon system feed is totally autogenic , with suspended circulation 60 meters above the base level. By the means annual and seasonal discharge analysis registered during the observational period ( see Tab.2) , the major and more regular runoff regime was proved in Ancon system as compared with Canilla system. This is in correspondence with the physico-geographical conditions and rainfall distribution in both basins and consequently , the infiltration rate for the Ancon system was higher ( 70-85%) than for the Canilla system(35-40%). The higher and more stable waters mineralization of the Ancon system than the ones of the Canilla is in function of the combined effect of some hydrodynamical, lithological and microbiological factors. According to all above mentioned , the mean annual and seasonal karstic denudation values for the observational period (see Tab.3) are remarkably higher in the Ancon system than in the Canilla system (115-130 and 40-50m3/km3 year respectively). It must be emphasized that the denudation process in Cuban tropical climatic conditions , is a continuous and seasonal uninterrupted process during all the year and keeps up practically the same intensity during the rainy season(60%) than during the less rainy seasons , in function of the homogeneous spatial and temporary rainfall distribution. It does not happen in temperate and polar latitudes where during the greatest part of the year the karstic processes have a lower dynamics or it is practically stopped. The karst denudation values reported in Pan de Guajaibon massif for a complete five years hydrological cycle , give a reliable measurement of this process intensity in the tropical Cuban lower mountain karst.
Guaso Plateau
New Program: Zapata Basin
Unlike the researching program in hills and lower mountains karst areas , a new investigation program concerning to the process, dynamics and environmental changes in the tropical karst of Cuba , has been started on a plain karst region: Zapata basin, in the southern karstic plain of Matanzas province. Zapata basin comprises all the south slope of Matanzas province. It is a complex open sea karstic aquifer system, developed fundamentally in carbonate and carbonate-terrigenous Miocene transgressive sequencies , which compose the major part of the emerged area of the Cuban archipelago. The distinctive water circulation particularities of the Zapata aquifer system in relation to these kind of aquifers and its relatively easy hydrodynamical behavior , depend on the presence of the structural depression in the southern part of the basin , filled up by carbonate Pliocene-Pleistocene deposits , over which , the big marsh area of Zapata Swamp has been developed. From a hydrodynamical point of view , it obviously is a holokarst basin with 150-200 meters of estimated karstification thickness , in which , some aquifer levels and not less than three superposed drainage systems are found , defined by textural differences into the limestones and frequently interconnected by really hydrogeological windows. Interesting karstic processes of accelerated corrosion by mixed waters , saline effect and biochemical factors, occurred there , as well as the aquifer water overexploitation, uncontrolled waste waters inputs, agricultural intensive exploitation and other anthropogenic impacts,increase the sea waters intrusion and the aquifer contamination processes. The development of an international investigation program in the Cuban plain karst areas, are very interesting from the scientifical and practical points of view , not only within Cuban boundaries, but also in all the Caribbean basin and Gulf of Mexico coastal region, which have had the same geological history and evolution from the Neogene and Quaternary and wherever , these kinds of karst plains , with similar hydrological and hydrodynamical characteristics can be found.
Tab. 1 Annual climatic mean parameters values for the obersavational period in Pan de Guajaibon Experimental Basin and it’s comparison with the hyperannual standards
| Parameters Mean Values Hyperannual Standards Representativity (%) |
| Precipitations (mm)
PRI---400 1770 1900 93 PTI---222 1790 1900 94 PRI---222 1650 2000 93 PRI---02 1779 1900 94 PRI---03 1871 2000 94 Temperature (°C) 24.5 23 106 Relative moisture (%) 7:00 Hs 90 95 95 13:00 Hs 75 70—75 100 |
Tab. 2 Water balance for the observational period in both karstic systems of Pan de Guajaibon experimental basin ( Mean annual and seasonal parameters )
System Area
(km2 ) Season Q (m3/s
) I (mm ) P ( mm ) IC ( % ) E
( mm) Dry 0.173 622 853 73 231 Guajaibon Dry 0.244 403 803 50 400 |
Q —debit ; I—infiltration ; P—precipitation ; IC—infiltration coefficient ; E—evapotranspiration .
Tab. 3 Mean annual and seasonal karst denudation values for a complete hydrological cycle in Pan de guajaibon experimental basin .
System Area(km2 ) Season Q
(m3 / s ) W ( MM3 ) Y ( l/s.km2 ) EC
( uS.cm-1 ) T( mg/l) AT (mg /
l ) A (m3 ) D (m3 /
km2 ) Dry 0.173 2.83 39.7 334 206 186 201 46 Guajaibon Dry 0.244 4.07 25.8 317 197 177 271 28 |
W—Total runoff ; Y—Yield ; EC—Electric Conductivity ; AT , T –Mineralization .
Tab. 4 Hydrological information analysis and water balance of Guaso Plateau
| Detailed
water balance of Guaso upper basin for the observational
period (Jan.
20 –Feb. 8 , 1988 )
Area
( km2 ) P ( mm ) Q ( m3 /s
) Y ( l /s.km2 ) W ( MM ) R=iI
( mm ) IC ( % ) |
| Estimated
hyperannual water balance of Guaso and Bano river basin
( 1964—1987
) .
A(km2 )
P(mm ) Q(m3 /s) Y(l/s.km2) W(MM) R=iI(mm)
rI(mm) tI(mm) IC(%) E(mm) |
i I , rI , tI—Intermediate regional and total infiltration ; R—surface runoff .
Tab. 5 Chemical denudation of Guaso Plateau
| Guaso river basin
karst denudation hyperannual values for Guaso and bano
rivers.
A(Km2) t (days) Q (m3/s) Y(l/s.km2) W(MM) EC(uS/cm-1) T(mg/l) AT(mg/l) A(M3) D(m3/km2.t) Guaso Ponor 36 20 0.965 26.8 1.67 280 173 153 102 2.8 Guaso Resurgence 93 20 1.192 12.8 2.07 317 197 177 146 1.6 |
| Estimated
karst denudation hyperannual values for Guaso and Bano
rivers.
System A(Km2) Q (m3/s) Y(l/s.km2) W(MM) EC(uS/cm-1) T(mg/l) AT(mg/l) A(M3) D(m3/km2.t) Guaso 93 1.17 12.6 37 317 197 177 2609 28 Bano 71 1.64 23.1 52 377 234 214 4422 62 Guaso Massif 164 2.81 17.1 89 347 215 195 6904 42 |
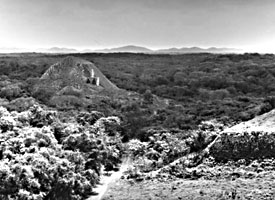
Cockpit Country in Jamaica is the type location for cockpit karst. Cockpit Country was the name given to the area by the British in the 17th century because it reminded them of the then-popular cock-fighting arenas which were hot, humid and dangerous places where men gathered to watch and bet on the "sport". Note that cockfighting is illegal now (but is still practised -Easter 2001- in some areas of Jamaica): the concept was still familiar enough to aviators in the early 20th century for them to use "cockpit" as the name for their station on an aircraft. The word "karst" derives from 'Kras' in Slovenia:- "a dry, waterless place". Although the Cockpit Country receives high rainfall annually (1500mm to 2500mm), it is still considered "waterless" because limestone acts as a sponge: surface water is drained vertically and rapidly and each cockpit bottom ("sink") is drained by a sinkhole. Don't hike without a guide! (See one group's experience)
 |
 |
|
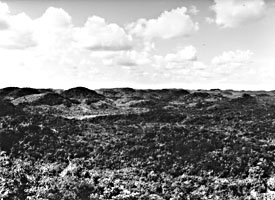
The formation of Cockpit Country started about 12 million years ago with a faulted limestone plateau when Jamaica emerged from the sea. The plateau rose to about 600m (2000ft) above sea level, with a tilt of between 5 and 15deg to the NW. Erosion of this plateau formed the regular array of round-topped, conical hills and sinks that we know today. There are at least two theories as to how cockpit karst forms. The "solution" theory holds that heavy tropical rainfall washing through a fissured limestone plateau over millions of years dissolved and eroded the fissures and washed the debris through the sinkholes eventually out to sea.A recent researcher measured the orientation of the faults in the area and found them to be largely aligned along three primary axes mutually at 120 degrees. |
 |
|
He surmises that a sinkhole forms when three faults intersect.This theory provides an explanation of the typical, regularly-spaced, round-topped, conical hills.At the top of the hill, the water moves slowly so that little erosion takes place; as the water runs down the hill, it gathers momentum and also gathers debris so that its scouring action becomes more and more pronounced. This accounts for the slope being so steep at the base. Of course, each cockpit has one or several sinkholes but there is a tendency for these to become blocked by debris. |
 |
KARST LANDFORMS AND LAKES
Robert W. Blair, Jr.*
INTRODUCTION
This chapter is concerned with the recognition and origin of karst topography and certain types of lake basins and is not intended to be a comprehensive text-style dissertation on either karst or lakes. For more specific information, see Jennings (1971), Sweeting (1972), or Hutchinson (1957). The category of lakes, although a separate topic from karst, has been included because we believe that it does not warrant a special chapter and because the number of good images displaying karst is limited. The approach is by necessity a regional one, with little discussion related to landforms that are not observable from space.
KARST
Introduction
The term "karst" stems from the region Krs in Slovenia, now in northwestern Yugoslavia, which is typified by stony barren rock (Figure 7.l). The Indo- European word "kar" for rock and the Italian word "carso" evolved to the Germanized term"karst," which is now the accepted term for solution-derived landscapes like those just north and east of the Adriatic Sea.Karstification is the geologic process of differential chemical and mechanical erosion by water on soluble bodies of rock, such as limestone, dolomite, gypsum, or salt, at or near the Earth´s surface. Karstification is exhibited best on thick, fractured, and pure limestones in a humid environment in which the subsurface and surface are being modified simultaneously. The resulting karst morphology is usually characterized by dolines (sinkholes), hums (towers), caves, and a complex subsurface drainage system.
Factors in Karst Development
The development of karst terrain depends on the interplay of at least seven important factors in varying degrees. These are: lithology, structure, relief, hydrology, climate, vegetation, and time.
Lithology. Several lithologies are susceptible to karstification, but limestones and dolomites, owing to their solubility and nature of resistance and widespread distribution, are overwhelmingly dominant. According to Pettijohn (1975), 75 percent of the Earth´s surface is covered with sedimentary rocks, and of that, 10 to 20 percent consists of limestones or dolomite. Karst morphology can occur on carbonates with less purity than 80 percent, but generally the purer the limestone, the better the development of karst morphology (Jennings, 1971). For example, the Cretaceous and Early Tertiary Dinaric karst limestones of Yugoslavia are 95 to 100 percent pure (Herak, 1972), and white limestone in Jamaica seldom exhibits less than 98 percent purity. Numerous compositional variations can exist in carbonates, and many of these are discussed in Sweeting (1972) and Jennings (1971).
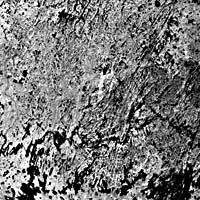 |
Figure 7.1 |
|---|---|
 |
Map 7-1 |
Figure 7.1. Part of Landsat image 3009-09094-7, June 8, 1978, showing the type locality region of karst topography in the Slovenian Dinaric Mountains of Yugoslivia. The map, taken from an article by Demek et al. in Geomorphology of Europe (C. Embleton, Ed.) (1984) shows karstic features in approximately the same region. Numbers on the map refer to poljes: (1) Grosupeljsko, (3) Globodol, (13) Losko, (14) Babno, (15) Postojnsko, (17) Crnovrsko, (18) Zadlog. Key to symbols: (1) blind valley, (2) pocket valley, (3) dry valley, (4) dry valley system, (5) border polje, (6) overflow polje, (8) dammed polje, (9) karst doline, (10) uvala, (11) karst plain (Demek et al., 1984).
In addition to the composition of limestone, the thickness of individual beds, the nature of interbeds, especially shaly beds, and lateral facies variations affect the style and degree of karstification. In the Dinaric Mountains, the depth of surface karstification is sometimes limited by impermeable beds which have aided the development of broad flat-floored valleys called poljes (Herak, 1972).
Structure. Structure is used here in the structural geologic sense and is concerned with the attitude and deformational effects of bedrock. Limestones and dolomites at or near the surface tend to deform by brittle fracture. This tendency to form complex joint sets is directly responsible for the secondary permeability required for the development of subsurface solution drainage and subsequent three-dimensional cave development. Vertical fractures usually manifest themselves at the surface and focus the solution processes along them. The influence of fracturing is paramount in southeast China, where thousands of square kilometers are affected by several consistent sets of joints (see Plate KL-1, karst of south China). Folding, in addition, may have the effect of isolating watersheds and directing ground-water flow. This has occurred in the Dinaric karst of Yugoslavia.
Large-scale structures or tectonics not only have led to the development of specific landforms like poljes but have also influenced the rates and degree of karstification. Most poljes, for example, are associated with boundary faults (Roglic, 1972). Uplift and deformation of a carbonate plateau accelerates the dissolution of the limestone because: (1) fracture density increases, (2) any elevation rise is usually accompanied by an increase in precipitation, and (3) increased relief increases piezometric surface gradients. These conditions can: (1) lead to solution-enlarged conduits along fracture planes, (2) impart to the limestone a high hydraulic conductivity, and (3) cause rapid fluctuations in the water table with accompanying accelerated solution (Fetter, 1980)
Relief. Topographic relief is the elevation difference between the highest and lowest points on the surface for a given area. The Julian Alps in the inner region of Yugoslavia have a topographic relief near 2000 m. This mountainous area is associated with an abundance of potholes and few caves. Both characteristics are thought to be a consequence of this high relief (Herak, 1972). Related to relief is the depth of the vadose zone, which is the vertical distance between the surface and the water table. In Florida, the vadose depth is small, as is the topographic relief. However, throughout low sea level stands during the Pleistocene, the increased depth of the vadose zone probably led to the development of a more extensive and efficient subsurface drainage system with an increase in dissolution along fractures and fissures. With the absence of the buoyancy effect of a high water table surface, the formation of collapse dolines may have been accelerated (see Plate KL-4, Florida karst). Even today the effects of water table drawdown due to excessive pumping have rendered some urban areas susceptible to the sudden and unexpected collapse of buried solution cavities. Such a collapse occurred in Winter Park, Florida, in May 1981.
Hydrogeology. Hydrogeology is concerned with the interrelation ships of geologic materials and processes with water (Fetter, 1980). The karstification process involves not only the solution of limestone but also the sometimes overlooked mechanical erosion of limestone. Because the solution chemistry of carbonates is well known (Jennings, 1971; Sweeting, 1972; Bogli, 1980), only a brief summary will be presented here.The dissolution of limestone involves three principal components: carbon dioxide, water, and calcium carbonate. Initially, atmospheric carbon dioxide diffuses into the moisture within the air or soil and simultaneously becomes hydrated to form carbonic acid:
CO2 + H2O <-> H2CO3
In the presence of limestone, carbonic acid dissolves the calcite. The reaction is often presented as:
| CaCO3 + CO2 + H2O | <-> | Ca++ + 2HCO3- |
|---|---|---|
| limestone | dissolved limestone |
The only water that is capable of dissolving limestone is aggressive water, which is water undersaturated with respect to dissolved carbonate. The time required for aggressive water in karst regions to be neutralized or to reach saturation equilibrium varies considerably, depending on a number of factors such as temperature, turbulence, variations in the partial pressure of carbon dioxide, dilution, presence of other acids, and surface area of limestone. To achieve equilibrium may require several days; however, laboratory studies suggest that most of the limestone dissolution resulting from an influx of fresh aggressive water may occur within minutes to a few hours (Sweeting, 1972; Jakucs, 1977; Ritter, 1978). Additional acids, such as organic acids from soils and most recently sulfuric and nitric acids from acid rain, will contribute to the dissolution of carbonate rocks.
Once saturation equilibrium is achieved, any change to warmer water temperatures or decreases in the partial pressure of carbon dioxide can drive equation 7-2 to the left, resulting in the deposition of calcium carbonate (see Figure 7.2).
Erosion rates have been calculated for many karst regions around the world and vary widely even within the same climatic zone (Smith and Atkinson, 1976).
 |
Figure 7.2. Saturation equilibrium curves for solution of calcium carbonate at selected temperatures as a function of carbon dioxide equilibrium in solution (modified after Jennings, 1971, p. 26). |
|---|
Table 7-1 lists some of the calculated erosion rates for karst regions discussed in this chapter. Although these erosion rates are useful for comparative purposes, they are not indicative of the duration intensity of the erosion process. The dissolution of the limestone does not take place at a constant rate, but fluctuates with storm events that flood the karst surface and subsurface with undersaturated water. In other words, the actual dissolution occurs episodically with maximum peaks corresponding to surges in the karst water flow. In Jamaica, intense storm events result in subsurface flooding, and because the existing conduit system is not of sufficient size to handle excessive infiltration rates, backfilling of caves and solution channels occurs with fresh undersaturated water (Versey, 1972). These flood events can be of the single-storm variety or may be seasonal, as with the winter flooding of poljes in Yugoslavia.
Because of the unusually high permeabilities and the periodic flooding associated with most karst regions, the water table correspondingly exhibits drastic fluctuations. This has been observed by many spelunkers. The water table in karst rock is frequently difficult to define, especially in free- flow carbonate aquifers that display a complex multitude of enlarged open conduits. The water table can occur at considerable depths below the land surface, especially in mountainous regions like the Dinaric Mountains, Yugoslavia. Water can also be perched under solution depressions above the water table or it may be discontinuous if the permeability is principally fracture-controlled (Fetter, 1980). Zones with few or no fractures yield little or no water, in contrast to dense fracture zones that can potentially supply abundant water.
Table 7-1
Erosion Rates for Image Areas Discussed
| Location | Erosion Rate (m3/km3/yr) |
Climate |
|---|---|---|
| Florida USA* | 35,5,8 | Tropical |
| Jamaica* | 69,39,86,96 | Do |
| Yucatan, Mexico* | 30,16 | Do |
| Guangxi, S.China+ | 120-300 (surface) | Do |
| Dinaric karst, Yugoslavia* | 43,63,55,67 | Temperate |
| S. Nullarbor Plain, Australia± | 5 (surface) | Semiarid |
+Daoxian, 1981.
±Lowry and Jennings, 1974.
Climate. The best-developed karst regions of the world are found in tropical (e.g., Jamaica) and temperate (e.g., Yugoslavia) environments. Considerable discussion has evolved as to whether tropical or temperate environments are more conducive to karstification (Smith and Atkinson, 1976). Lehmann (1970), a strong advocate of climatic geomorphology, asserts that solutional erosion rates are more intense in the tropics because of greater rainfall and carbon dioxide production in soils at higher temperatures. In contrast, Corbel (1959) contends that the intensity is greater in cold humid climates where larger quantities of carbon dioxide can be absorbed by water. The higher the carbon dioxide absorption in water, the stronger is the resultant carbonic acid. However, because Corbel overlooked the rates of reaction, which slow down at lower temperatures, the levels of CO2content may be irrelevant (Embleton, 1985, personal communication).
The absorption of carbon dioxide is temperature-dependent so that cooler water for a given volume can absorb larger quantities of carbon dioxide. If the water temperature rises from 0 to 35°C, the carbon dioxide saturation level will decrease between one-third to two-thirds (Jennings, 1971). Therefore, waters in cold climates can hold greater quantities of carbon dioxide in the ionic state, thus being more effective in dissolving limestone. However, more important than temperature is the partial pressure of carbon dioxide, which at sea level is relatively constant at 0.035 percent. The partial pressure of carbon dioxide in soil air can exceed that of the atmosphere from ten to several hundred times (Bogli, 1980). As a consequence, the presence and nature of soil cover can be far more important in karstification intensity than atmospheric air.
A study by Smith and Atkinson (1976) of comparative karst data from around the world indicates that mean annual runoff, rather than precipitation, is the principal parameter directly related to erosion rate. Temperature is believed to be important only with regard to its influence on supporting a continuous cover of soil and vegetation.
Vegetation. Arid karst regions, such as the Nullarbor Plain in Australia, are associated with sparse vegetation, thin soils, and therefore, a slowed rate of surface karstification. In contrast, if the existing soil and climate can support a dense vegetation cover, an intensified surface and subsurface karstification occurs, as observed in Jamaica and south China. Biogenic carbon dioxide, introduced to the soil by plant root systems and bacterial decay, is regarded as the most important control of solution erosion of limestones (Jennings, 1971).
Generally, where vegetation is most lush, the highest concentration of moisture, the highest biogenic activity, and the highest production rates of carbon dioxide occur. Under these conditions and free water circulation, the highest solution erosion rates can be achieved. Such conditions are found in both Jamaica and south China (Table 7-1). In Jamaica, the forest canopy has been cited as one of the prime factors responsible for the overdeepening of cockpits (Versey, 1972).
Time. The early karst studies of Cvijic and Grund at the turn of the 20th century were strongly influenced by the cyclic evolutionary teachings of Davis and Penck (Roglic, 1972). Thus, karst topography has been thought to evolve through stages of development beginning with fluvial action and the initial formation of dolines. As the surface drainage is slowly captured by swallow holes and the developing subsurface drainage, dolines coalesce to form uvalas, which, in turn, expand to poljes. This sequence is now considered to be antiquated, and according to Roglic, poljes are structurally controlled and are not related to uvalas.
It is questionable whether any two karst regions anywhere in the world have evolved sequentially in the same manner or even display identical morphological forms. Each karst region evolves within its unique combination of dynamic and static factors. However, this does not preclude the comparison of areas of similar morphology in an attempt to evaluate common factors.
From the examples of Landsat imagery in this chapter, it becomes apparent that each region has developed its own morphologic signature. To understand the evolution of a given karst terrain, it is necessary to comprehend the roles of length of time, style, and intensity of the energy flow through the hydrologic system. Those karst regions with the largest potential energy, related to the thickness of the vadose zone, and kinetic energy, or flooding, will also exhibit a higher energy morphology more rapidly and more fully than regions of lower total energy. High-energy morphology can be manifested in the form of larger caves, increased relief, density, and magnitude of dolines, hums, flood deposits, and a more extensive underground solution network.
KARST FROM SPACE
Within the realm of geomorphology, each geologic process leaves its own imprint on the Earth´s landscape, and each process will develop its own characteristic assemblage of landforms (Thornbury, 1969). For karst landscapes, this imprint is expressed as solution morphology on the regional scale. Because of the relatively large ground resolution distance of 79 m, many karst landforms cannot be discerned from Landsat MSS images; only the larger solution and fracture-controlled dolines and uvalas can be recognized. Thus, the advantage of the space perspective is not the identification or the recognition of individual landforms, but the collective pattern and texture they impart to a region of hundreds or thousands of square kilometers. This can occur only where given geologic processes and materials, such as carbonates, dominate a large region for a sufficient length of time.
The Landsat imagery discussed in this chapter has been chosen from the known karst regions of the world. Some well-researched regions are not included either because good imagery has not been available (e.g., New Guinea) or because man´s overprint (e.g., Indiana, U.S.A.) is so dominant as to obscure natural topographic patterns.
A cursory examination of all the karst images reveals a number of features specifically associated with the solution process:
- Lack of drainage patterns (all karst regions)
- Dimpled pock-marked texture (Jamaica, Nullarbor Plain)
- Fracture sets with developed relief (China)
- Uniformly scattered residual karst hills (Yucatan, China)
- Circular basins or lakes (Florida)
- Large flat karst plains and poljes (Yugoslavia, China)
Most important is the absence of a well-developed integrated surface drainage. Indeed, for the Nullarbor Plain, Australia, and Yucatan, Mexico, it is difficult to identify any recognizable drainage. Major rivers can be seen to incise the south China carbonate plateaus, but there is a distinct lack of well-developed tributaries draining into the river channels.
Most karst areas exhibit a relatively homogeneous pock-marked or dimpled texture. In south China, this pattern is overprinted with solution- incised joint sets. In Florida, the pattern is expressed as numerous large water-filled collapsed basins.
Joint sets are not recognized in all karst areas at Landsat scale. This does not preclude the presence of joints, but merely points out that they may be obscured because: (1) joints are too closely spaced, (2) solution relief of joints is slight, (3) dense vegetation cover is present, or (4) joints may indeed be absent or sparse.
What accounts for the large differences observed in karst regions is not variation in the karst process, but variation in lithology, structure, and the overprint of other processes like fluvial, tectonic, eolian, and glacial, and variations in the energy flow through the karst system through time.
LAKE BASINS
Introduction
According to the American Heritage Dictionary (Dell Publishing Co., Inc., 1983), a lake is defined as "a large inland body of water." The interpretation of the word "large" is conjectural. For our purposes, a lake must be large enough to be recognizable on Landsat imagery, which is limited by the ground resolution distance of 79 m and 30 m for the MSS and TM sensors, respectively. It is because of the presence of water that we easily recognize and focus our attention on these geomorphic forms. To develop a lake requires two things: (1) geomorphic process(es) to form a depression, and (2) the proper hydrologic and climatic conditions to maintain a confined body of water on the Earth´s surface.
Classification
Virtually every geomorphic process is capable of producing a depression either singly or in combination. A classification of lakes is, in essence, a classification of various geomorphic processes. Davis (1882) proposes a classification of lakes based on constructive, destructive, and obstructive processes, and Hutchinson (1957) presents a detailed classification system based on various geologic processes.
The following is a modified Hutchinson classification:
- 1. Tectonic processes
- a. Epeirogeny (Caspian Sea, U.S.S.R.)
- b. Tilting (Lake Kioga, East Africa)
- c. Rifting (Lake Baikal, U.S.S.R.)
- 2. Volcanic processes
- a. Caldera collapse (Lake Rotorua, New Zealand)
- b. Explosion crater (Ruapehu Crater Lake, New Zealand)
- c. Lava flow collapse (Yellowstone Lake, Montana, U.S.A.)
- 3. Colluvial processes
- a. Catastrophic landslide (Earthquake Lake, Montana, U.S.A.)
- b. Noncatastrophic slope failure (Goatswater, English Lake District, Britain)
- 4. Glacial processes
- a. Ice-dammed lakes (ancient Lake Missoula, U.S.A.)
- b. Glacial scour lakes (Lake Michigan, Michigan, U.S.A.)
- c. Moraine-dammed lakes (Jenny Lake, Wyoming, U.S.A.)
- d. Kettle lakes (Nushagak Lowlands, southeast Alaska, U.S.A.)
- 5. Solution processes
- a. Dolines (lakes of north central Florida, U.S.A.)
- b. Polje (Lake Scutari, Yugoslavia)
- 6. Fluvial processes
- a. Plunge pools (Castle Lake, Washington, U.S.A.)
- b. Oxbow lakes (Mississippi River floodplain, U.S.A.)
- 7. Coastal processes-Lagoons (Lake Ellesmere, New Zealand)
- 8. Eolian processes
- a. Dammed lakes (Moses Lake, Washington, U.S.A.)
- b. Interdune lakes (lakes in Nebraska Sandhills, U.S.A.)
- c. Deflation basins (Avenue Pan, Witwatersrand, South Africa)
- 9. Impact processes-Explosion crater (Chubb Lake, Canada)
- 10. Life processes
- a. Beaver dams (generally too small for Landsat)
- b. Manmade dams (Lake Nasser, Egypt)
Origin
One objective of this section is to study various lake basins observable from space, and from their geometry, geologic, and geomorphic associations, point out characteristics that could reveal information about their origin. The study of the origin of lakes can be segmented into two lines of inquiry: (1) causes of topographic depression, and (2) explanation for the presence of water. The first line of inquiry listed is more amenable to study through space imagery than the latter. Note that many depressions exist that do not contain water, and as a consequence, their presence may be overlooked.
Physical criteria useful in the analysis of lakes from space are shape, size, density, and nature of the surrounding terrain.
Shape. Lake shape in many instances can narrow the choices of geologic process responsible for an inland depression. Circular topographic basins, for instance, can be produced by collapse (dolines, calderas), by explosions (volcanic craters, meteoric impact), or from wind (deflation hollows). Circular lakes, associated with these processes and visible on Landsat imagery, include the doline lakes in north central Florida, the caldera lakes from Nicaragua, a volcanic crater lake at Crater Butte, California, an impact lake in Chubb Lake, Quebec, and the deflation hollow lakes found on the Llano Estacado, Texas.
The best-developed elliptical basin lakes are the Carolina Bays in North and South Carolina and the oriented lakes of Alaska. Surface wave erosion, aided by wind at right angles to the long axis, is believed to be the major controlling factor in their elongation (Kaczorowski, 1976).
| Figure 7.3a.. This Landsat scene (1057-16305-7), September 18, 1972) shows numerous linear lakes produced by glacial scouring along fracture zones in Canadian Shield crystalline rocks in the Lac La Ronge area, central Saskatchewan. | |
|---|
Dammed drainage basins produce dendritic lake patterns. The dams may be natural or, more frequently, manmade. In 1959, Earthquake Lake formed as a result of the Hebgen Lake earthquake, which jolted into motion 20 million m3 of rock and debris that subsequently dammed the Madison River in southwestern Montana (Costa and Baker, 1981). Lake Kioga in East Africa formed after epeirogenic tilting reversed the drainage in a large watershed and caused the eventual flooding of the tributary valleys. Manmade reservoirs are especially abundant in the southeastern United States, but they may be found in virtually every country of the world.
Linear lakes, including many on the Canadian Shield (Figure 7.3a and Figure 7.3b), are commonly imposed on fracture- or fault-controlled zones of weakness that localize streamflow or are gouged out by glacial scour. Triangular lake basins are found in the stabilized dune fields of Senegal. Rectangular lake basins have been noted in northwestern Yukon Territory, Canada; their origin is unknown, but structure and permafrost probably play a role in their development. Lunate or oxbow lake basins are common along meandering river channels such as the Mississippi River. These lakes are formed from abandoned meanders, usually during flood cycles. Irregular or amoebic-shaped lake basins are frequently associated with glacial till and are caused by the differential melting of buried ice or by water filling the low points on a hummocky moraine. These lakes are common in north-central North America and in Scandinavia. Some lake basins are so irregular and abundant that they resemble ink-splatter patterns and can be found in Canada, in Scandinavia, and in Siberia where large areas of bedrock have been laid bare by continental ice sheets. Frozen tundra, bedrock structure, and differential erosion have contributed to their highly irregular pattern.
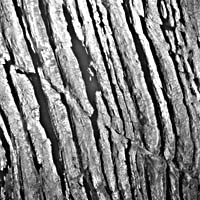 |
Figure 7.3b. Aerial view of glacial scour lakes along fractures in the eastern Canadian Shield (Canadian Department of Energy, Mines, and Resources, A11607-84). |
|---|
Size. Of the world´s ten largest lake basins based on water surface area, six have a tectonic origin and four are glacially derived (Smith, 1968). At various times during the Pleistocene, glacial lakes have grown in size and probably out-numbered large tectonic lakes. Lake Bonneville in the Basin and Range of Utah and Minchin Lake in Bolivia are examples. These pluvial lakes were large because the cooler climate during glacial periods favored the storage of surface water. The largest lake basins have developed in response to a regional stimulus in contrast to small isolated lakes that may result from local influences.
Density. The density of lake basins per unit area can again indicate the regionality of a geomorphic process. The tens of thousands of lakes in central Canada and north-central United States reveal the ubiquity of the glacial process. The Carolina Bays of the southeastern United States and the oriented lakes of Alaska exhibit the regional influence of wind and, in the case of Alaska, further influence by permafrost. With isolated small lakes, such as Earthquake Lake, Montana, local geomorphic processes must be examined to determine the lake´s origin.
Associated Terrain. Clues to a lake´s origin, as viewed on Landsat imagery, are frequently revealed by the regional overprint of a particular geomorphic process. The presence of dune fields in Senegal and glacial moraines in Quebec, Canada, and the abundance of volcanoes around Lake Nicaragua, all suggest to the observer a cause-and-effect relationship. Many rift lakes display straight-lined shores with angular bends mirrored on the opposite shore. Inland faults may parallel the lake edge and indicate a tectonic origin. Lake Tanganyika is an example. Lakes associated with the dimpled surface texture indicative of karst topography may well be water-filled dolines. The Dinaric Mountains of Yugoslavia have a few lakes of this variety. However, the most well-developed karst regions of the world as in Yugoslavia, south China, and Jamaica do not display abundant lakes. This is due, in part, to the efficient infiltration of precipitation and a subterranean piezometric surface.
Time
Within our timeframe, lakes may develop catastrophically from volcanic eruptions, landslides, and earthquake activity, or they may form from slower acting processes like wind, glacial, and epeirogenic activity. However, it is important to emphasize that, geologically, lakes are temporary and form rapidly and decay quickly (Smith, 1968). Because most of the Earth´s land surface is dominated by fluvial erosion, lakes that do occur are threatened with either capture and draining by expanding tributaries or infilling of sediment until the lake becomes extinct. The mere presence of a lake, then, demonstrates the dynamic restlessness of the Earth´s surface.
PLATE KL-3
CENTRAL YUCATAN
PENINSULA
 |
 |
|---|---|
| Plate KL-3 | Map |
This image includes part of the Yucatan Platform within the Yucatan Peninsula in the states of Campeche, Quintana Roo, and Yucatan. Although no coastline is exposed in the image area, it is surrounded on three sides by the sea. This part of Mexico receives between 1000 mm of rainfall near Merida and 1500 mm toward the south edge of the image. Nearly all of this rain falls between May and September. Of the total precipitation, approximately 85 percent returns to the atmosphere via evapotranspiration, while the remaining 15 percent infiltrates to the ground-water table (Hanshaw and Back, 1980). As can be seen from the image, no drainage network has developed over the region; thus, runoff is insignificant.
The Yucatan Peninsula and adjoining continental shelf (Campeche Bank) consist of relatively flat-lying Tertiary carbonates (Figure KL-3.1) covering some 350 000 km2 of area (Weidie et al., 1978). The Campeche Bank extends about 200 km into the Gulf of Mexico both north and west of the peninsula. The narrow Caribbean shelf borders the peninsula to the east and rarely exceeds a few tens of km in width. The exposed Tertiary rocks attain thicknesses up to 1000 m in northwestern Yucatan and consist primarily of dolomites, limestones, and marls. Most of the surface rocks exposed in the image area are Eocene and Paleocene in age. Other ground scenes typical of karst terrain in the Yucatan are shown in Figure KL-3.2 and Figure KL-3.3.
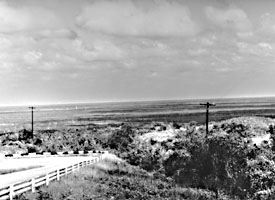
The most prominent structure in the region is the Ticul Fault and associated Sierrita de Ticul escarpment, which trends N60W for about 200 km (see index map and image). Movement on the fault has probably been sporadic since the Late Cretaceous (Weidie et al., 1978). Sierrita de Ticul is a series of hills, forming an arcuate ridge with a relief of nearly 50 m (West, 1967). The Sierrita marks the boundary between the flattish Yucatan Plain to the north and the hilly Campeche region to the south. Most of the Yucatan Peninsula is dominated by karst topography (Figure KL-3.3) consisting of cenotes (steep-walled sinks that usually penetrate the water table), bare limestone platforms, aquadas (broad shallow solution basins), and resumideros (funnel-shaped conical depressions). The cenotes and aquadas are the two most important sources of water in the region, and as a consequence, most of the Mayan cultural development and population centers are found to be closely associated with these karst features. Where the limestone is not bare, it is covered with a thin terra rossa soil, usually less than 20 cm thick, developed on weathered limestone (Hanshaw and Back, 1980). Where bare limestone is exposed, it often exhibits deep solution channels or karren that can pose a problem for vehicular travel (West, 1967).
It is because of the karst that no surface drainage exists in the northern and central parts of the peninsula. The high porosity and permeability of the limestones provide for an efficient internal drainage (Southworth, 1984). The Yucatan Peninsula is similar to Florida because both have thick sequences of relatively flat-lying Tertiary limestones; however, in Yucatan, the lack of Upper Tertiary clays and marls overlying the limestone results in rapid infiltration or rainfall. The presence of an extensive interconnected subsurface drainage network is suggested by: (1) a gentle piezometric surface gradient that has been measured as 1.2 to 1.5 m above sea level in areas 80 km inland from the coast at an elevation of 30 m above sea level, (2) the lack of notable drawdown observed in heavily used wells, and (3) the young age of water dated from its C14 content (Hanshaw and Back, 1980).
Hanshaw and Back (1980) believe that chemical mass wasting in the zone of dispersion is perhaps the most important geomorphic process in the region. From their measurements on the concentration of dissolved solids, the surface in places could be lowered by as much as 340 mm/1000 yr. This figure is misleading, however, because much of the dissolution occurs along subterranean passageways.
The karst nature of the image area can be recognized by the lack of any developed drainage network and by the presence of residual karst knobs found south of Sierrita de Ticul. Lago de Chichancanal (see index map) may be fracture-controlled like some of the lakes east of the image area that are influenced by the Holbox fracture system. Alignment of cenotes due to fracture control has also been documented in the eastern part of the peninsula (Southworth, 1984). Landsat 21089-15115, January 15, 1978.
BOOK REVIEWS
Caribbean Journal of Science, Vol.
34, No. 3-4, 340-341,1998
College of Arts and Sciences, University of Puerto Rico, Mayagüez
Jamaica Underground. The Caves, Sinkholes and Underground Rivers of the Island. Por Alan G. Fincham. The Press University of the West Indies (Barbados, Jamaica, Trinidad and Tobago), 447 páginas y 16 láminas a color. Disponible con cubierta de cartulina o de cartón.
La segunda edición del libro Jamaica Underground viene a cubrir con creces el vacío dejado por la primera edición de la obra, que desde hace varios años está agotada. Esta edición incluye contribuciones prepara-das por varios científicos dedicados a distintas ramas relacionadas con el estudio de las cavernas, los cuales son bien conocidos por su larga experiencia en trabajos de campo en las Antillas Mayores 5• especialmente en Jamaica. Gracias a esto, el libro es una fuente única de información, no sólo sobre el karst y las cuevas, sino también sobre bioespeleología, paleontología, hidrogeología y otras especialidades, así como sobre la historia de las investigaciones espeleológicas en Jamaica. Sobre esta base se puede afirmar que Jamaica Underground es el único volumen existente con un trata-miento abarcador de los problemas más importantes de la espeleología y karstología jamaicanas.
El libro está dividido en once capítulos y nueve apéndices. Hay tres capítulos dedicados a la historia de la exploración de cuevas y la espeleología en Jamaica (A. Fincham, R. Read, y T. Shaw), la geología de las cavernas jamaicanas (G. Draper, y G. Wadge), la geomorfología de las regiones calizas (G. Draper, y A. Fincham), la hidrología de las cavernas jamaicanas (A. Fincham), la paleontología (R. D. E. MacPhee), y los invertebrados (S. Peck) y vertebrados (D. McFarlane) de las cuevas jamaicanas. Un pequeño capítulo trata el problema de la histoplasmosis, una enfermedad provocada por hongos (A. Fincham). La mayor parte del libro está dedicada al catálogo de las cuevas Jamaicanas, que con más de 1,200 registradas, incluye descripción, mapas y anotaciones históricas. La bibliografía incluye unos 500 títulos, algunos de ellos anotados. Los apéndices abarcan un listado de la ubicación de las cavernas, las cuevas más largas y más profundas de Jamaica, la distribución de las cuevas por tipos y edad de las rocas, una clasificación morfológica de las cuevas, un glosario de términos especializados y otros datos importantes.
La isla de Jamaica presenta
una superficie de 11,420 kilómetros
cuadrados, de los cuales 2/3 están ocupa-dos por rocas
calizas del Terciario. Jamaica se conoce bien entre los karstólogos,
por ser la localidad tipo del karst cockpit. Este tiene una morfología
muy peculiar determinada por la combinación de colinas
y valles de geometría cónica, que vista desde el
aire tiene el aspecto de la pared de un panal de abejas. También
se describen el karst de torres, las poljas, y muchas otras formas
del relieve, incluidas las acanaladuras y micro acanaladuras.
Dos mediciones de la actividad del karst en Jamaica arrojan valores
de 72 y 86 mm/1,000 años.
Los espeleólogos jamaicanos han descubierto y cartografiado
más de 1,200 cuevas en la isla, tanto secas como sumergidas
bajo las aguas subterráneas. De acuerdo a su morfología,
estas cavernas se clasifican como pasadizos, laberintos, salones,
caídas verticales, solapas y sus combinaciones. Su origen
se relaciona al flujo vertical de las aguas de lluvia, al flujo
horizontal de las aguas fluviales y la combinación de
ambos. Sin embargo, los movimientos del agua subterránea
también dependen de la estructura interna de los macizos
calizos (planos de estratos, grietas y fallas, así como
la porosidad primaria y secundaría). Las cuevas más
profundas son Dunn's Hole (230 m), Morgans Pond Hole (186 m)
y Volcano Hole (177 m), mientras que las más largas son
Gourie Cave (3,505 m), Tackson Bay Cave (3,360 m) y Still Waters
Cave (3,355 m). La altura a que están localizadas las
cuevas varía entre 0 y 1,200 metros, pero predominan aquellas
entre 0 y 800 metros; reflejo del relieve montañoso moderado
de Jamaica y de la altitud de los macizos calizos.
Jamaica Underground está también dedicada a cuestiones
de bioespeleología. Leyendo el libro uno aprende que,
en sólo 60 cuevas estudiadas hasta el momento, se han
encontrado 250 especies de macro invertebrados, 42 de ellas estrictamente
troglobias. Estas cifras indican el gran potencial de estudio
que aún tienen las cuevas jamaicanas. Veintiocho especies
de vertebrados se han encontrado en los ambientes cavernarios,
incluyendo peces, anfibios, reptiles, pájaros y mamíferos
(jutías y murciélagos). Pero las cuevas de Jamaica
también guardan el tesoro de los restos fósiles
de 14 especies de animales ya extinguidos, incluidos primates,
roedores, aves y reptiles.
Un elemento relevante de este libro
es el catálogo bien
documentado de las cuevas jamaicanas, que incluye muchos mapas,
secciones transversales y longitudinales, descripciones y algunas
anotaciones históricas. Esta base de datos tiene un gran
valor por si misma, pero sobre todo, servirá de fuente
para nuevas investigaciones sobre la espeleología y el
karst de la isla.
Cada persona tiene su opinión sobre como se debería
escribir un libro; por eso no es totalmente justo afirmar que
a esta obra le falte tal o cual aspecto. A mí me hubiera
gustado ver un capítulo sobre las formaciones cristalinas
de las cuevas, otro dedicado al estudio de los procesos que operan
en la formación y transformación kárstica
de los macizos de calizas, y un trata-miento más extenso
de los problemas referidos a la karstología ambiental.
En conclusión, considero que el libro Jamaica Underground
puede recomendarse como una obra que no debe faltar en la biblioteca
de los interesados en la espeleología y el karst, así como
en los departamentos de Ciencias de la Tierra de las universidades
e instituciones científicas. El público en general
no sólo disfrutará las muchas y bellas fotografías
a color que contiene el libro, sino que verá en él
una obra de referencia muy útil para conocer mejor los
misterios y las bellezas de la naturaleza.
DR. MANUEL A. ITURRALDE-VINENT, Miembro de la Sociedad Espeleológica de Cuba, Museo Nacional de Historia Natural, La Habana Vieja, Cuba.